


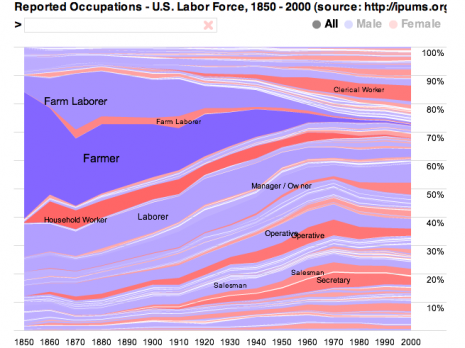
This visualization shows stacked time series of reported occupations in the United States Labor Force from 1850-2000. The data has been normalized: for each census year, the percentage of the polled labor force in each occupation is shown. The data is originally from the United States Census Bureau and was provided by the University of Minnesota Population Center.